xpConsole
xpConsole enables you to see several data items at once for one, several, or all particles.
The emitter head-up display (HUD) enables the display of certain particle data.
However, only one data item can be seen at a time, from a limited subset of the available data and even a relatively small number of particles can hugely slow down the viewport playback.
xpConsole is extremely fast and will not slow down the viewport, even with large particle numbers.
Particle Data tab
Section titled “Particle Data tab”.DjXBO132_GbQko.webp)
The User Interface (UI) for xpConsole, Particle Data tab, on opening.
At the top of the window there are two tabs.
The data is shown in the Particle Data tab.
By default this is empty since no emitter has been provided and only the two default data items - the particle ID number (PID) and particle age are shown.
Emitter for Output
Section titled “Emitter for Output”Emitter, Get Active Emitter, Lock Emitter
Section titled “Emitter, Get Active Emitter, Lock Emitter”To display any particle data you first need to select an emitter.
You can do this by dragging an emitter from the object manager into the Emitter link field.
Alternatively, if an emitter is selected in the Objects Manager, you can click the Get Active Emitter button and the console will find the selected emitter and set the link for you.
If you have more than one emitter in the scene, then selecting a different emitter in the Objects Manager will automatically change the linked emitter to the newly selected one.
This isn’t always desirable, so if the Lock Emitter setting is checked, changing the selected emitter in the object manager will have no effect; this setting is on by default.
Once you have played a few frames of your scene, the UI will begin to present data.
.Bzs-LtBQ_Z29QKqB.webp)
xpConsole UI after 17 frames of animation.
You can see each data item displayed on a single line for each particle.
Note that the PID (Particle ID) is the same number you would see in the HUD if you turned on the Show Particle Index setting in the xpEmitter’s Display tab.
Be aware that, during playback, the display may not be updated and you only see changes in the displayed data once you pause or stop the playback; this depends on the Update option setting (see below).
Options tab
Section titled “Options tab”.B3qAUWlr_1A3OuD.webp)
UI for the xpConsole, Options tab.
Data to Display
Section titled “Data to Display”There are several rows of checkboxes, which are the data items to display in the Particle Data tab.
The various data items are listed, for reference, at the bottom of this page, with a brief description of each.
Show All, Hide All
Section titled “Show All, Hide All”You can use the Show All button, to display all the data items or Hide All, to show none of them.
Data to Display
Section titled “Data to Display”This is found at the top left of the window.
You can turn the various options on or off in the menu.
.GjfSkoAr_Z179qSN.webp)
Data to Display menu.
If you use the menu, the grid is automatically updated and there’s no need to click the Update Grid button.
It is more convenient to use the menu to show or hide individual data items but easier to use the Options tab if you have several data items to change at once.
Custom Data Values
Section titled “Custom Data Values”As well as the ‘standard’ particle data, you can display any custom data you may have added in the xpEmitter, Extended Data tab.
The console can show up to two of your custom data items (you may have added more, but only two can be shown in the console).
Displaying custom data is simple: turn on the Custom Data 1 and/or Custom Data 2 setting, then enter the ID number and name of the custom data into the corresponding ID and Name fields in this section.
Preferences
Section titled “Preferences”Text Color
Section titled “Text Color”The color to use in the particle data display.
Only used for the actual particle data items.
Filter Particles By
Section titled “Filter Particles By”By default, the console displays the data for all particles.
This is the case when this drop-down menu is set to the default setting of None.
The other options are: Single Particle, Number of Particles, Particle Range and Particle List.
No filtering; the data from all particles is shown.
Single Particle
Section titled “Single Particle”The data for one single particle is shown.
The particle is selected by entering its particle ID number in the Particle ID field.
If that particle does not exist - that is, it hasn’t been created yet, or it has been killed - no data will be shown in the display.
Number of Particles
Section titled “Number of Particles”The console will display the data for the number of particles given in the Max Particles field (this is the Particle ID field renamed).
If any of those first 10 particles die, they will be replaced by another particle, if one is generated.
If no more particles are generated, the remaining particles close up to fill the gap.
So in this mode you may see the list of particle IDs change, if particles are being deleted.
Particle Range
Section titled “Particle Range”In this mode, the particles whose ID numbers fall in the range specified by the Range Min and Range Max fields (Range Min is the renamed Particle ID field) are displayed.
If any particles are deleted, they will not be replaced in the data display unless there are more particles whose ID numbers fall in the given range.
Particle List
Section titled “Particle List”Should you want to compare results from three specific particles - for example, those with ID values of 3, 56, and 1028, you can enter a list of particles so that data from only the ones you specify are shown.
To do this, enter the list into the Particle List text field.
The list must consist of a list of particle ID numbers separated by commas, no other character will do.
Particle ID
Section titled “Particle ID”The particle ID value to show data for when the filter is set to Single Particle.
Max Particles
Section titled “Max Particles”The maximum number of particles to show data for when the filter is set to Number of Particles.
Range Min, Range Max
Section titled “Range Min, Range Max”The range of particles to display, using their ID numbers, when the filter is set to Particle Range.
Particle List
Section titled “Particle List”A text field for the list of particles to show when the filter is set to Particle List.
Decimal Places
Section titled “Decimal Places”The number of decimal places to show in the data grid for each item.
The Cinema 4D default value is three, but this is often unnecessary; in xpConsole, the default value is two.
You can change this to between zero and three (Cinema 4D cannot show more than three decimal places).
Update
Section titled “Update”Set as On Animation Stop, this drop-down menu controls when the grid is updated with the particle data.
The alternative setting is Each Frame.
On Animation Stop
Section titled “On Animation Stop”In this mode, the console will not be updated during an animation until you stop playback, then it will be updated.
This is faster than updating the console each frame, so will not slow the playback.
Each Frame
Section titled “Each Frame”With this option, the console is updated each frame.
While more convenient, it will take longer and may slow the playback if a lot of data needs to be refreshed.
Time Units
Section titled “Time Units”For Age and Lifespan data items, the result can be displayed either as Frames (the default) or Seconds.
You can change between them by using this menu.
Show Color
Section titled “Show Color”Set as As Color, by default, this drop-down menu is used to control how particle colors are shown in the data grid.
The other options are: RGB 0…255, RGB 0…1 and HSV.
As Color
Section titled “As Color”The particle color is shown as a colored bar.
RBG 0…255
Section titled “RBG 0…255”Colors are shown in RGB format ranging from 0 to 255.
Each component is shown separately.
RBG 0…1
Section titled “RBG 0…1”As for RGB 0…255, but the colors are in the range 0 to 1.
As for the RGB options but in Hue/Saturation/Value format.
Minimum and Maximum values
Section titled “Minimum and Maximum values”Sometimes, you need to see the lowest and highest values of a particular data item.
It’s not practical to scroll through a long list trying to pick these out, so the console can do it for you.
Simply double-click anywhere in the relevant column or on the column header, and a small box will appear, as below.
.Bwfdnri8_18r3ed.webp)
Minimum and Maximum values box.
Data Items
Section titled “Data Items”The particle’s ID number; it is recommended that you always show this data item.
Position
Section titled “Position”The particle’s position in the 3D world.
Velocity
Section titled “Velocity”The velocity comprises particle direction and speed in one vector; the magnitude of the vector is the speed.
You can opt to normalise the vector, in which case only the direction is shown.
Rotation
Section titled “Rotation”The particle’s rotation in HPB format.
By default it is [0,0,0] if particle rotation is not enabled.
The particle’s spin, that is, by how much it rotates each frame.
By default it is [0,0,0] if particle rotation is not enabled.
Particle age in either seconds or frames (depending on the setting in the preferences).
Lifespan
Section titled “Lifespan”Particle lifespan in either seconds or frames (depending on the setting in the preferences).
Editor Display
Section titled “Editor Display”A value representing the editor display of the particle.
All possible values are shown in the file oxparticle.h in the ‘res/description’ folder.
The particle color.
Radius
Section titled “Radius”Particle radius in scene units.
Particle speed in scene units per second.
Group ID
Section titled “Group ID”The group the particle belongs to.
If the particle does not belong to any specific group, or if there are no groups in the scene, this value is zero.
Particle mass.
Distance
Section titled “Distance”The distance, in scene units, the particle has traveled since birth.
Density
Section titled “Density”The particle density (only used when the SPH Fluid object is affecting the particle).
Temperature
Section titled “Temperature”Particle temperature value.
Particle fuel value.
Particle fire value.
Particle smoke value.
Expansion
Section titled “Expansion”Particle expansion value (used by the X-Particles Domain object).
Particle UVW value.
Only used when emitting from an object with UVs.
Vertex
Section titled “Vertex”Used by the X-Particles Particle Deformer.
This value is the vertex assigned to each particle.
Its value is -1, unless emitting from an object’s vertices and the setting One Particle Per Source Element is enabled.
Vertex Weight
Section titled “Vertex Weight”Used by the X-Particles Particle Deformer.
This value is the vertex weight of the vertex assigned to each particle.
It will always show the value 1,unless a vertex map has been applied to the object and the tag dragged into the Selection field in the xpEmitter’s Object tab.
Custom Data 1, Custom Data 2
Section titled “Custom Data 1, Custom Data 2”These are custom data values added in the xpEmitter’s Extended Data tab and perhaps subsequently altered by an xpCustomData modifier or action.
The internal flags used by the emitter and other objects to control the particle behavior.
There are 32 flags and all 32 are displayed (see below).
Fluid Density
Section titled “Fluid Density”The fluid density at the particle location.
It requires an xpFluidPBD object in the scene.
Fluid Surface
Section titled “Fluid Surface”How close to the surface of a fluid a particle is.
Higher values indicate that the particle is close to the surface.
It requires an xpFluidFX object in the scene.
Granular
Section titled “Granular”The ‘granularity’ of a particle, which is directly related to the number of neighboring particles.
Granularity levels are therefore lower nearer the edges of the fluid since the number of neighbors is lower.
It requires an xpFluidFX object in the scene.
Particle Flags
Section titled “Particle Flags”Each particle can have up to 32 possible flags.
These are shown in the console below (F0, F1, F2, etc.).
.kzIWd7zY_1yaGiL.webp)
xpConsole Particle Data tab, with Flag columns.
If a flag is set, an asterisk (*) is displayed; if not, the flag is clear.
The meaning of the various flags is shown below.
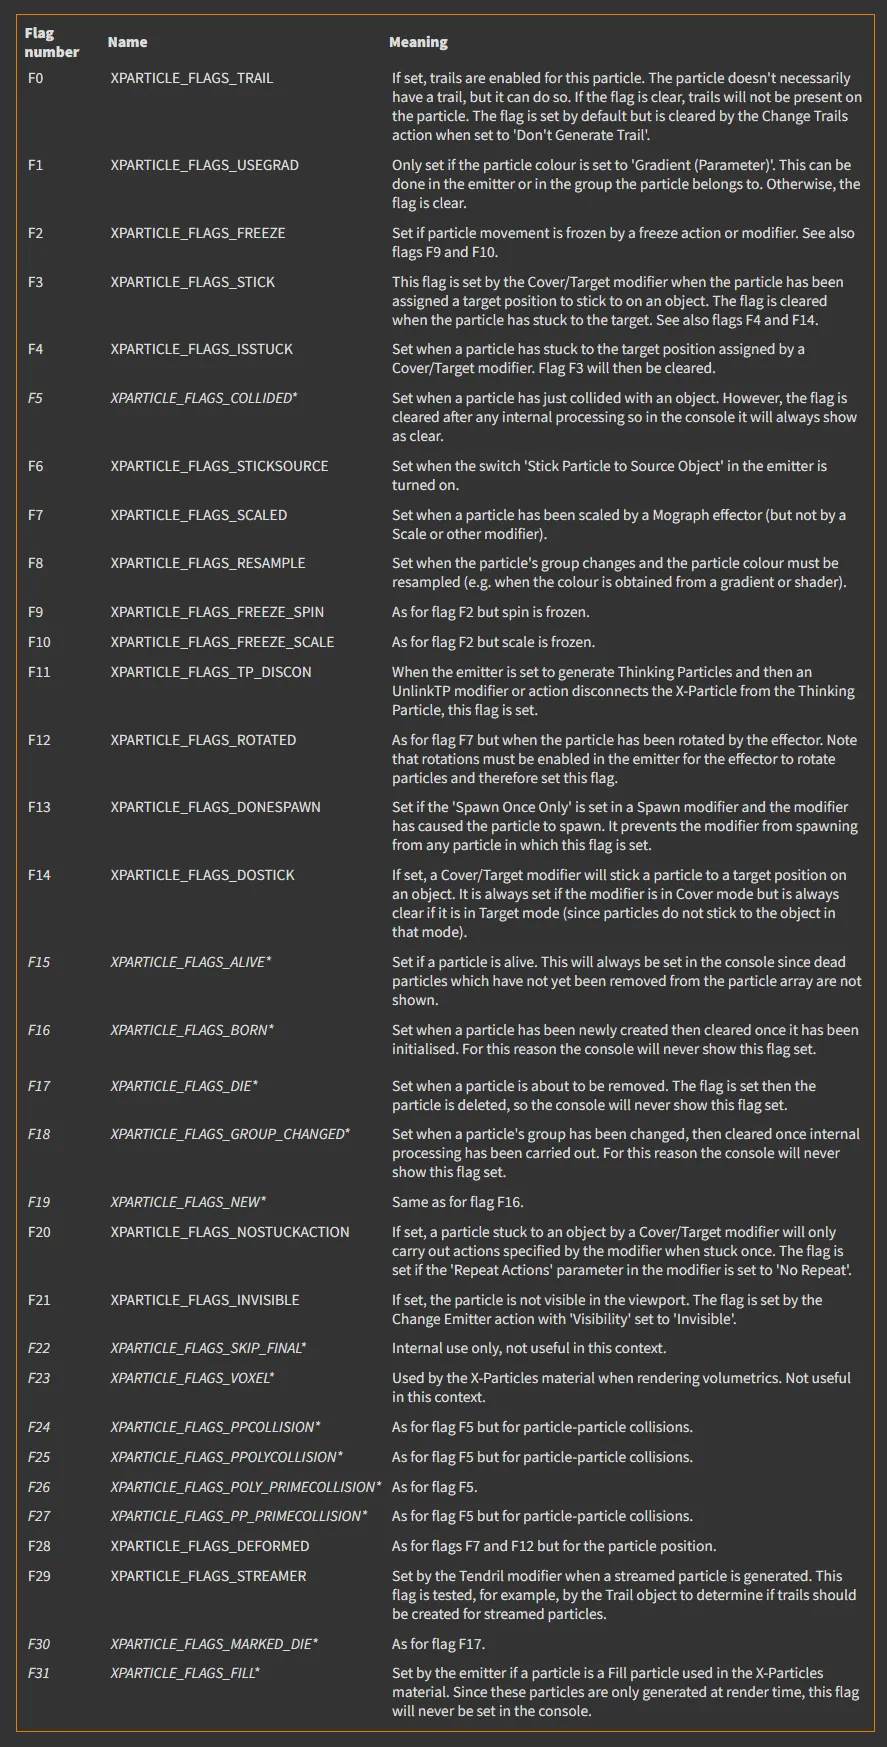
List of flags with their meanings.
Flags marked with ’*’ are not useful in the console either because they have no meaning outside of the emitter or some other object or because their values will either be shown as set or always clear.
Copyright © 2026 INSYDIUM LTD. All rights reserved.