Mapping
The parameters of all NeXus modifiers can be mapped to particle data, enabling dynamic changes during simulation.
The effects of the mapping are adjusted using the Range Mapping curve.
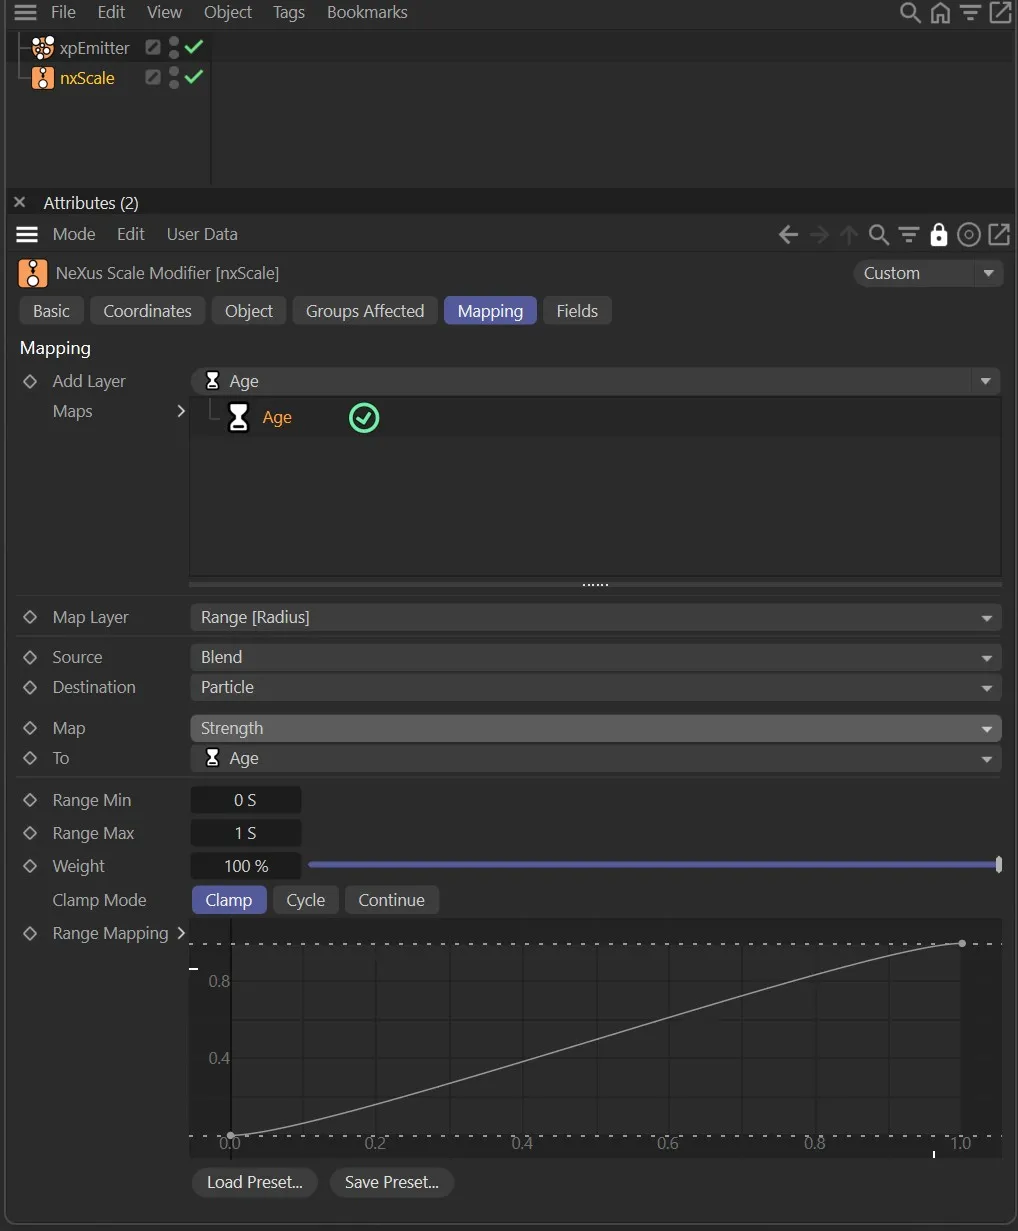
The settings can be found within the Mapping tab of each object.
In this animation, the effects of an nxScale modifier are being mapped to the particle’s age using the remapping curve. The result is the particles are growing and shrinking in size over time.
Add Layer
Section titled “Add Layer”There are twenty-one possible particle data types available, that will map a selected modifier parameter to the particle property.
These are: Age, Color (Brightness), Color R, Color G, Color B, Distance, Document Time, Fluid Density, Fuel, Granular, Group, ID, Life, Mass, Radius, Scale, Smoke, Speed, Temperature, Vertex Weight and Shader.
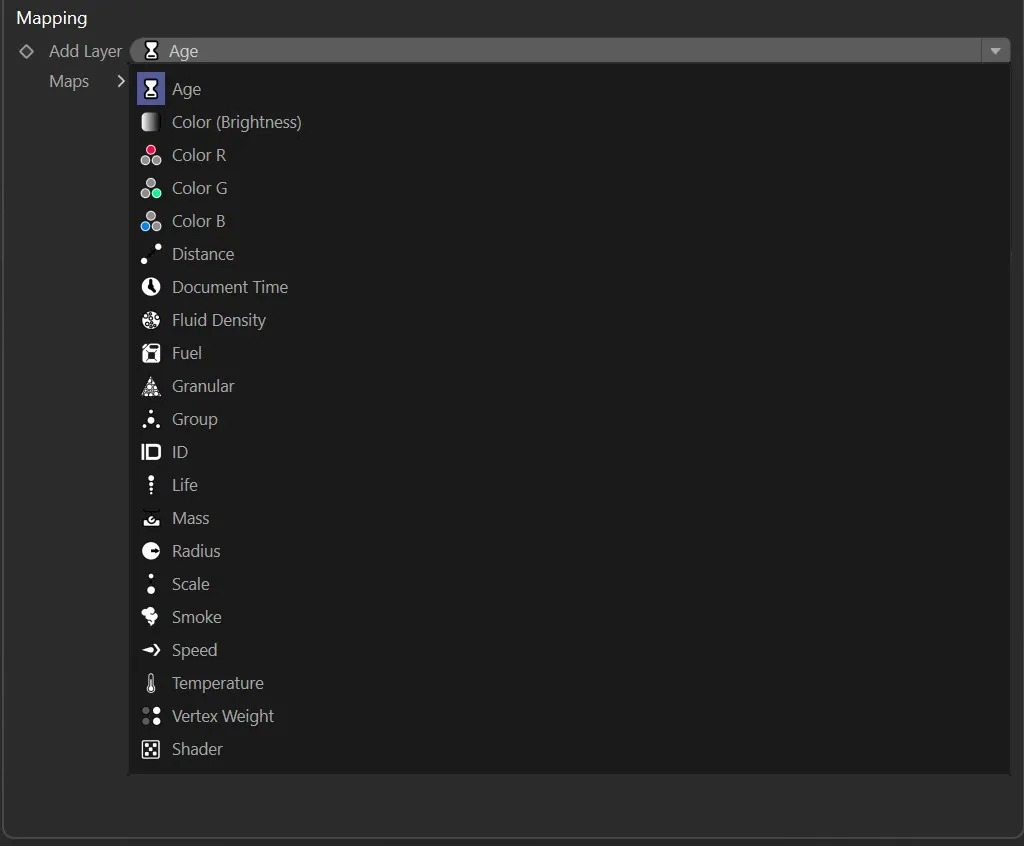
Layer type drop-down menu.
Clicking on a layer type will automatically put it into the Maps list.
Highlighting the layer type will then present you with the attributes available.
You can have as many layer types as you wish in this list.
Layer settings
Section titled “Layer settings”Each layer has the same attributes (except Shader, which has an additional parameter option).
To better explain the following options, we’ll use this example scene which uses an nxScale modifier.
In this animation, all particles have a radius of 20cm. This is because the nxScale modifier has been adjusted to set the value of the particle radius, according to the user-defined Radius Value, which is 20cm. Without any mapping active, the radius remains constant throughout the scene.
Parameter
Section titled “Parameter”Every mappable parameter from a modifier’s Object tab can be accessed from this list.
The contents will depend upon which modifier you’re mapping.
The nxScale modifier is setting the particle Radius Value at 20cm.
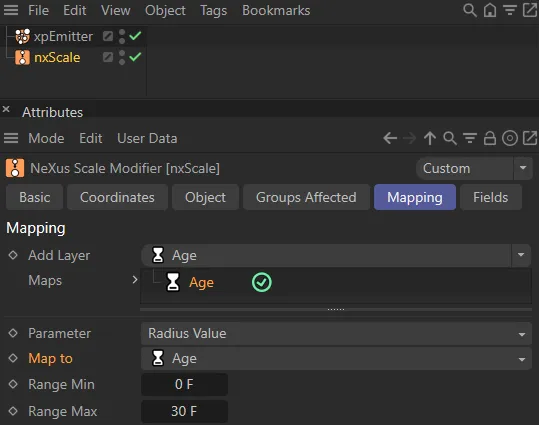
Here, the Radius Value has been chosen as the parameter to map.
Map to
Section titled “Map to”This is the particle data you are mapping the modifier parameter to.
By default it will be the same as that chosen when adding a new layer.
However, you can change this to any of the available particle data types.
The parameter is being mapped to the particle Age, in this animation. The result, with the rest of the settings in default, is that the particles are born with zero radius and grow over time. When they get to 1 second old, they have reached the radius value of 20cm, and stop growing.
Range Min, Range Max
Section titled “Range Min, Range Max”Use these min and max settings to define a range within the chosen particle data type.
For example, if using particle Age, a Range Min of 40 and a Range Max of 50 would mean that the remapping curve will affect particles when they are between 40 and 50 frames old.
With a Range Min of 0 and a Range Max of 60, the mapping curve in this animation is applied to the particles from when they are born to when they are 60 frames old. The result is the particles grow from 0 (zero) to 20cm over a 60 frame period.
Here, with a Range Min of 0 and Range Max of 180, the rate of growth is a lot slower. It takes 180 frames for the particles to reach 20cm in radius.
Clamp Mode
Section titled “Clamp Mode”Controls what happens when the particle data value falls outside the Range Min to Range Max range.
Set as Clamp, by default.
The alternatives are Cycle and Continue.
The mapping holds at the start or end value when outside the defined range.
The mapping repeats the range in a continuous loop.
Continue
Section titled “Continue”The mapping continues to extrapolate beyond the end of the range.
Weight
Section titled “Weight”The weighting strength of the parameter selected.
In this scene, the Weight is set to 50%, resulting in particles being born with 50% of the Radius Value. Therefore they grow from 10cm to the Radius Value of 20cm over the specified min/max range.
Range Mapping
Section titled “Range Mapping”This curve defines how the chosen modifier parameter is mapped to the particle data.
The horizontal X axis represents the chosen particle data, with 0.0 being the Range Min and 1.0 the Range Max.
The Y axis represents a multiple of the chosen parameter value, so at 1.0 (multiplied by 1) it will be the full value and at 0.0 (multiplied by 0) it will have no value.
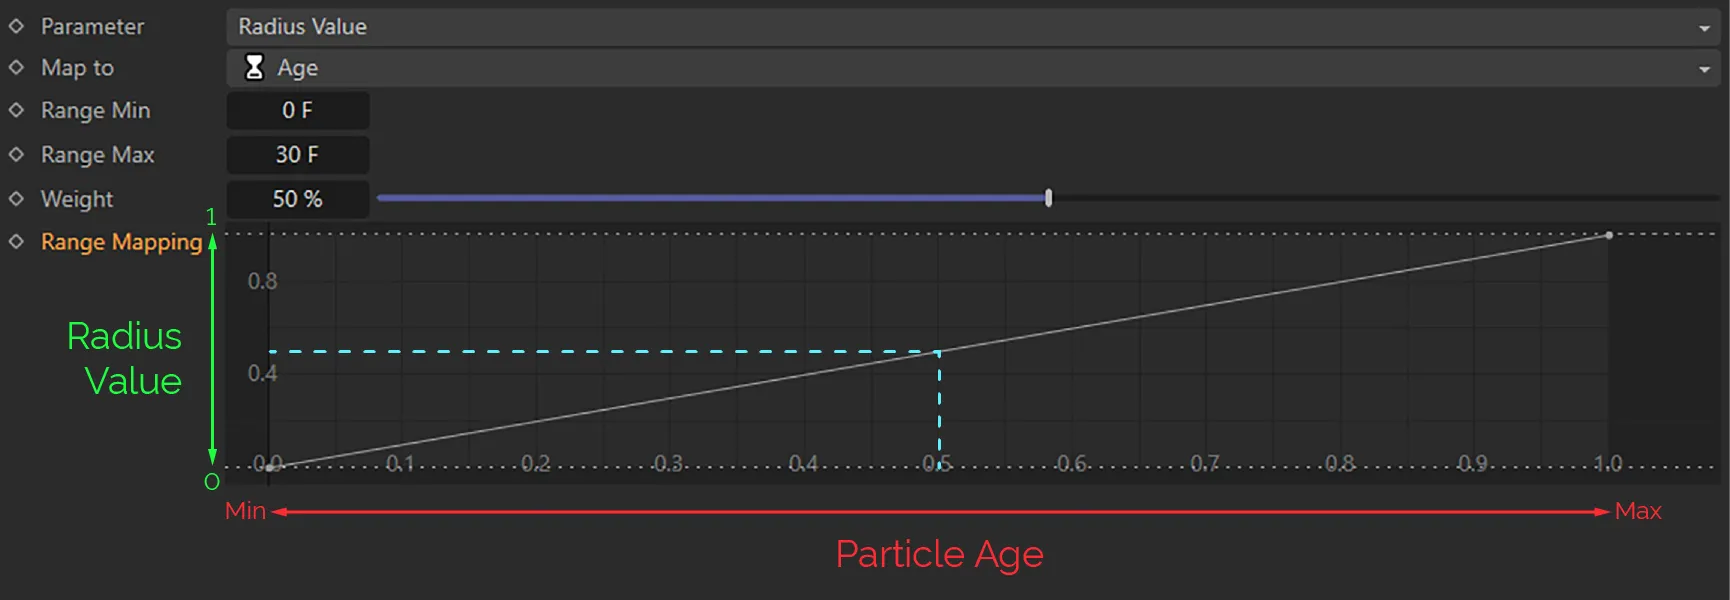
The Range Mapping curve, in this image, is mapping the Radius Value to the particle age. The X axis represents the particle age from 0 (zero) to 6 seconds (as defined by the Range Min and Range Max). The Y axis represents the Radius Value of 20cm. This graph can be used to assess how big a particle will be at any given age without even playing the scene. As you can see, when a particle is at the halfway point of the age range (3 seconds), it will have 0.5 x the 20cm Radius Value, which is 10cm.
Once the parameter, data and ranges have been set, it is possible to create multiple different effects by simply editing the remap curve.
In this animation, the Range Mapping graph is mapping the radius value (Y) against particle age (X), so with this downward curve, particles shrink over time.
In this final animation, the Range Mapping curve setting is directing the particles to bounce between smaller and larger radii.
Copyright © 2026 INSYDIUM LTD. All Rights Reserved.