xpWave
xpWave generates a velocity field which can create rolling waves within your fluid simulations.
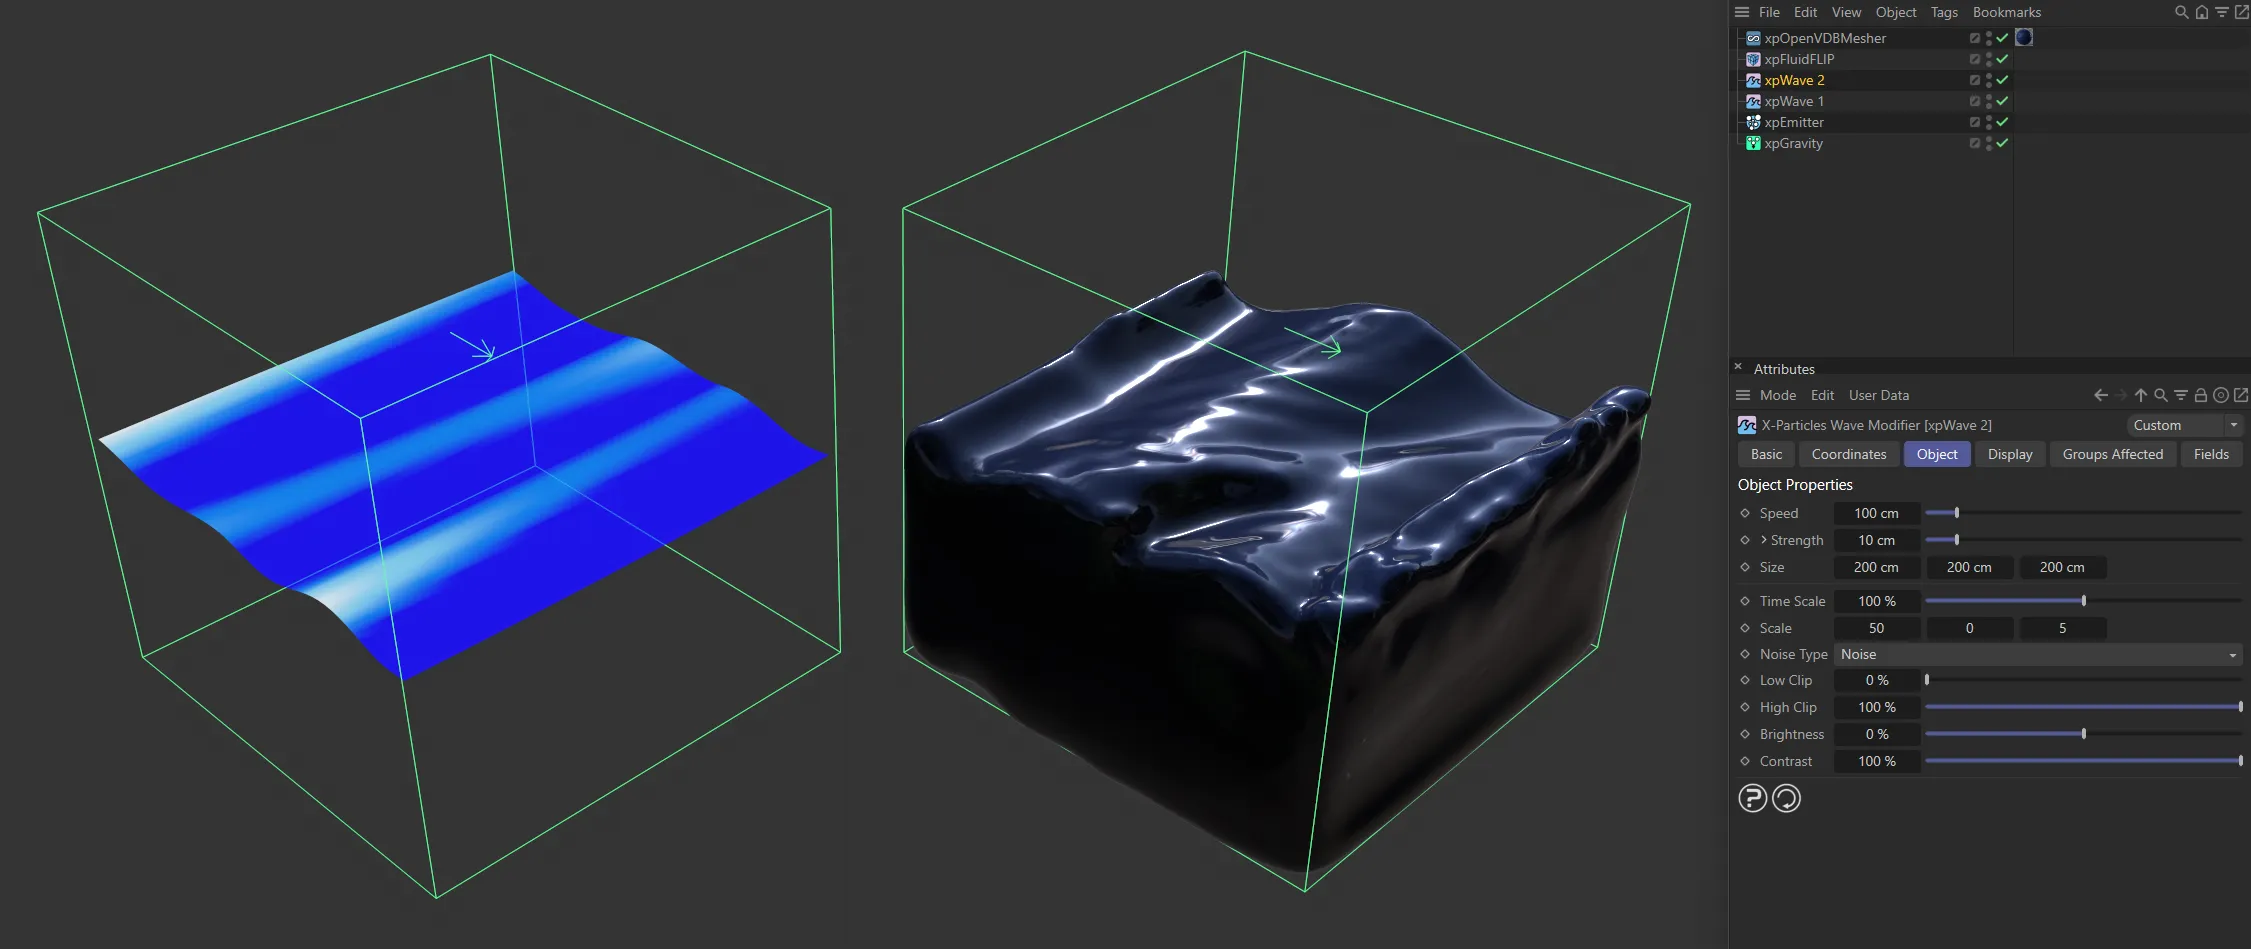
The xpWave deformation is shown by the blue plane and the direction of travel by the arrow.
Object Properties
Section titled “Object Properties”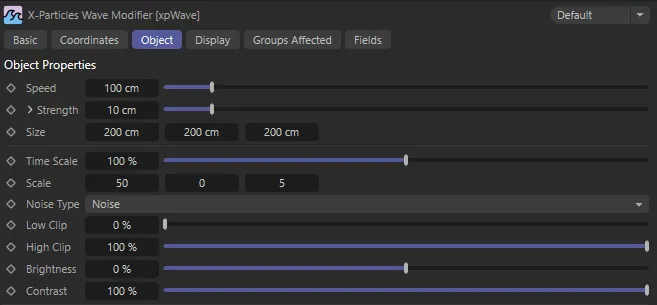
xpWave Object tab menu.
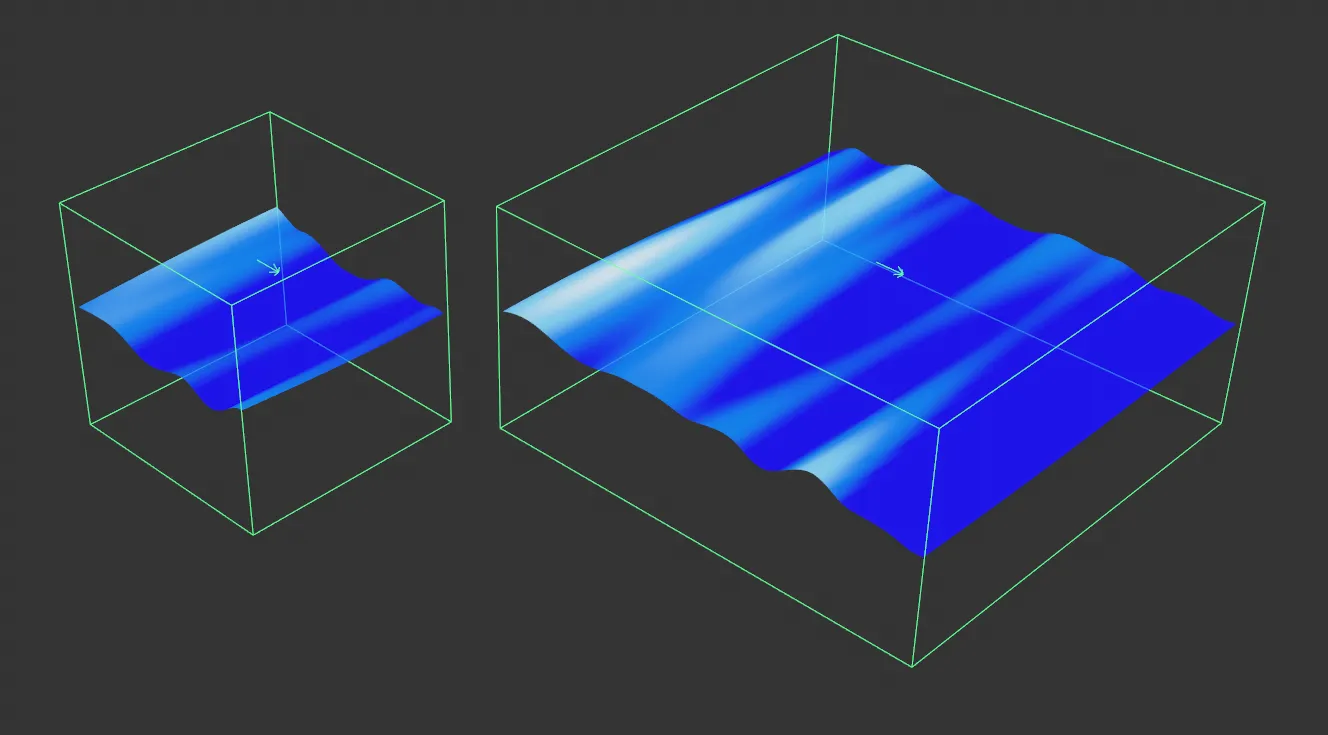
Sets the speed of movement of the waves (in cm/s), in the direction shown by the arrow in the solver.
The left-hand example is set at the default Speed of 100cm, in this animation. The right is increased to a Speed value of 200cm.
Strength
Section titled “Strength”The strength of the wave, which is directly related to the wave height.
The Strength value is 10cm, on the left, and 30cm, on the right.
Clicking on the arrow to the left of the Strength parameter, reveals the Falloff curve.
Falloff
Section titled “Falloff”This spline setting can be used to alter the wave strength over the length of the simulation.
For example, if you set the right-hand point in the spline to zero, the wave effect will reduce as the fluid particles travel the length of the fluid solver.
In this animation, there is the default setting for Strength and Falloff on the left. There is 60cm Strength set on the right, with a gradual Falloff, giving larger waves at the start, calming towards the end.
These controls can be used to set the size of the solver box area.
You can also use the sizing handles on the box to resize it, if you don’t need to set a precise size.
In this scene, there are two contrasting Size settings to the solver box area. The left-hand is set at 200 x 200 x 200cm and the right-hand is increased to 400 x 200 x 400cm.
Time Scale
Section titled “Time Scale”This parameter controls the animation speed of the noise used to generate the roll of the waves.
If it is set to 0 (zero) %, no animation occurs and the wave will not appear to move.
This scales the noise across the X or Z axes (the Y axis is not used).
Increasing these values will have the effect of smoothing the waves out along that axis.
Altering the Z axis scale effectively changes the wavelength of the waves.
Reducing the X axis scale increases the chaotic behaviour of the wave.

In this scene, the Scale is set at 50, 0 (zero) and 5, in the axes on the left and 2, 0 (zero) and 2, in the axes on the right.
Noise Type
Section titled “Noise Type”This drop-down menu enables the selection of one of the standard noise types.
Choose from all the usual Cinema 4D noise types, such as Simplex, Turbulence, Wavy Turbulence, FBM (Fractional, or Fractal, Brownian Motion), Voronoise and Cubic.
Six of the Noise Type settings available.
Low Clip/High Clip
Section titled “Low Clip/High Clip”These controls clip the maximum (peaks) and minimum (troughs) wave heights, relative to the Strength parameter.
You may see flat plateaus on the top and/or bottom of the wave pattern if these are changed from their defaults.
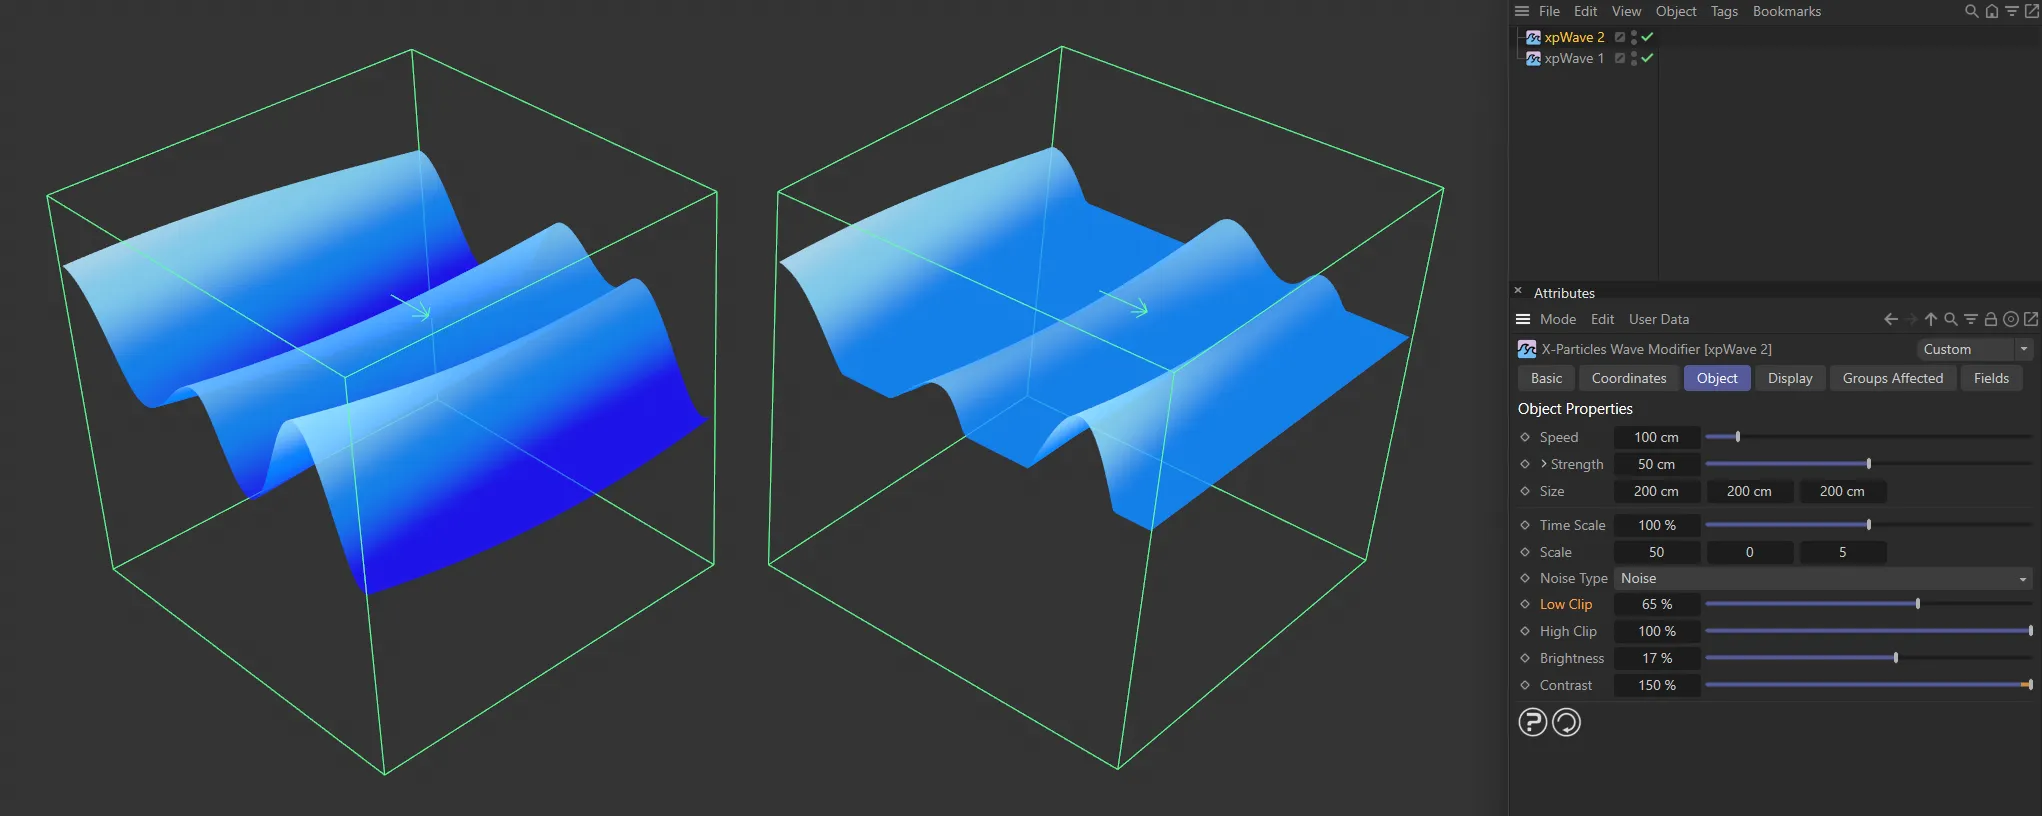
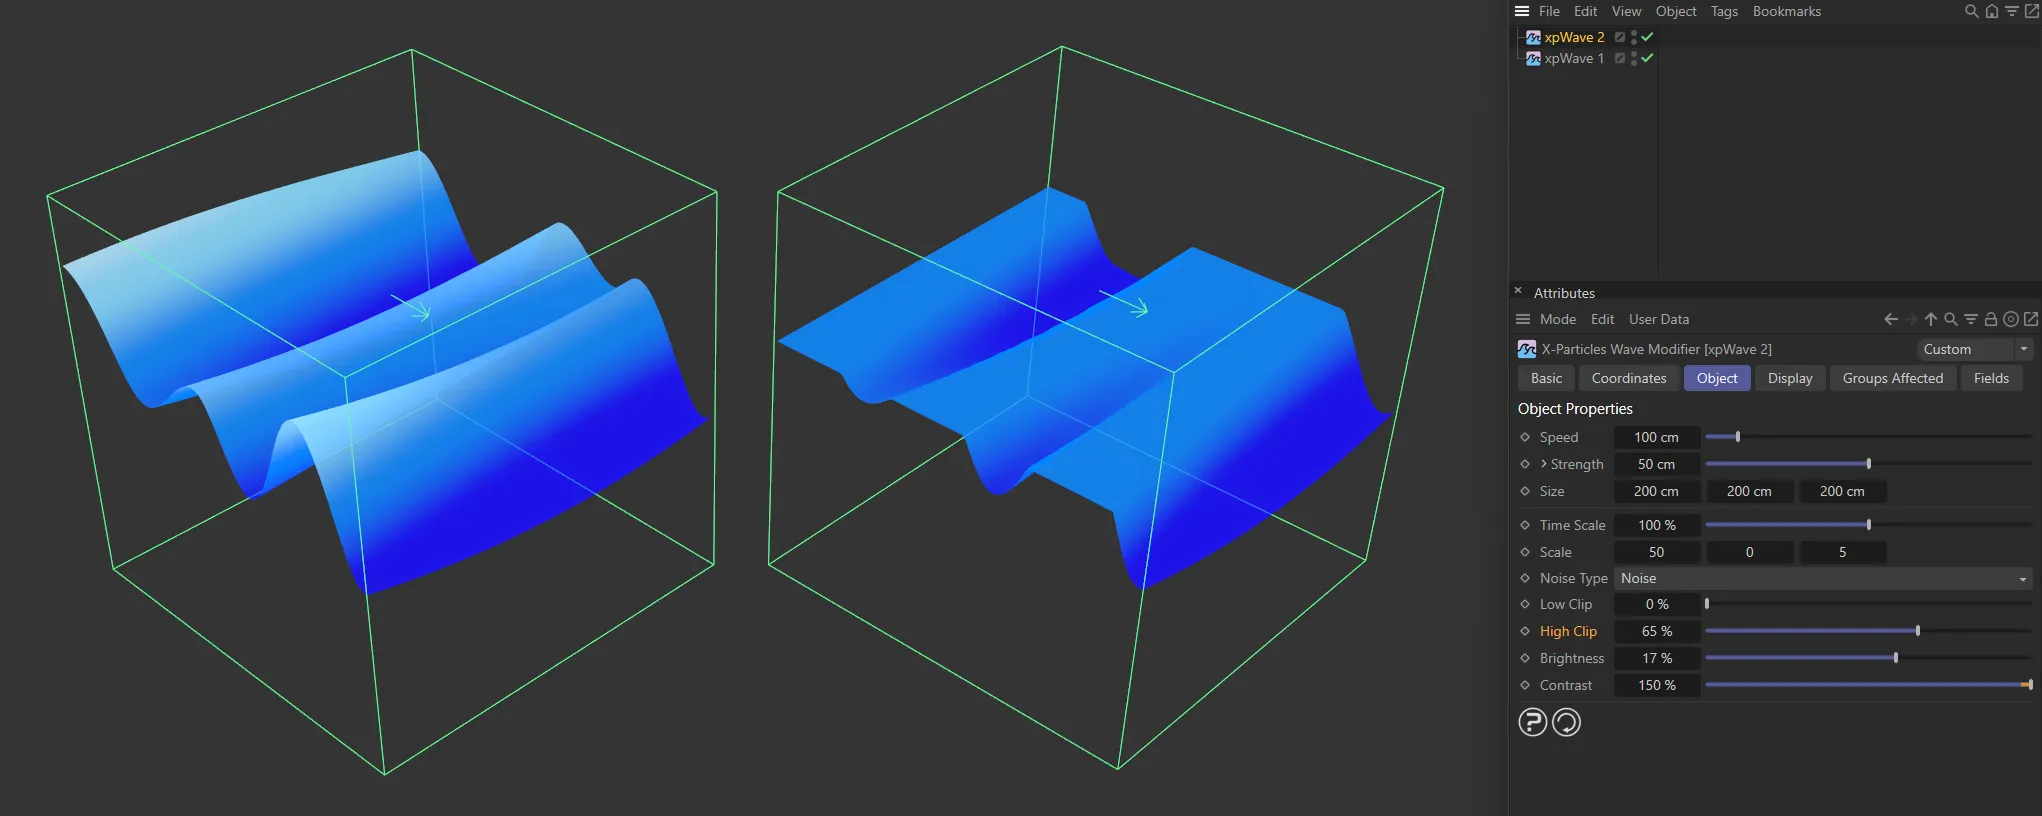
The Low Clip is set at 0 (zero) % on the left, with the High Clip at 100% (both are default) and on the right the Low Clip is raised to 65%.
Again, both the High Clip and the Low Clip are set at the default, on the left, while the High Clip is reduced to 65% on the right.
Brightness
Section titled “Brightness”This setting alters the brightness of the sampled noise, which will alter the strength of the effect.
Unlike the Strength parameter, this will raise or lower the height of all particles in the simulation.
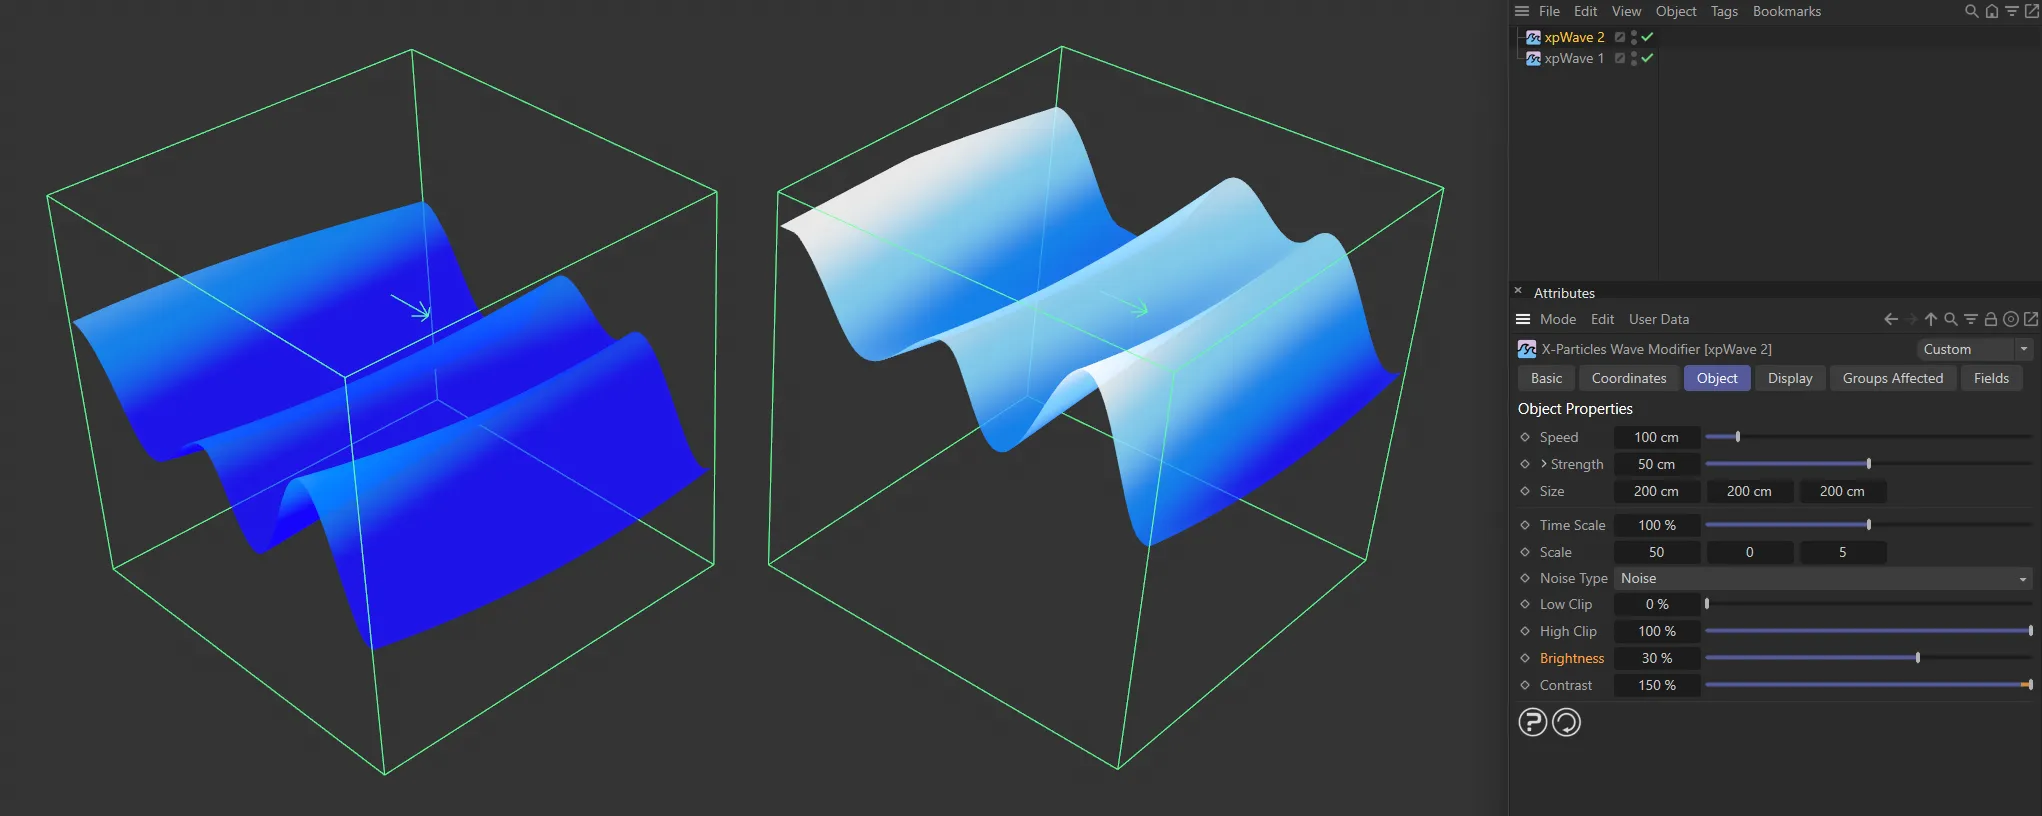
This image compares the Brightness settings of 0 (zero) %, on the left, and 30%, on the right.
Contrast
Section titled “Contrast”Reducing the contrast will reduce the difference between peaks and troughs in the wave.
If set to zero, there will be no waves at all.
If it is reduced below zero, the wave pattern will be inverted.
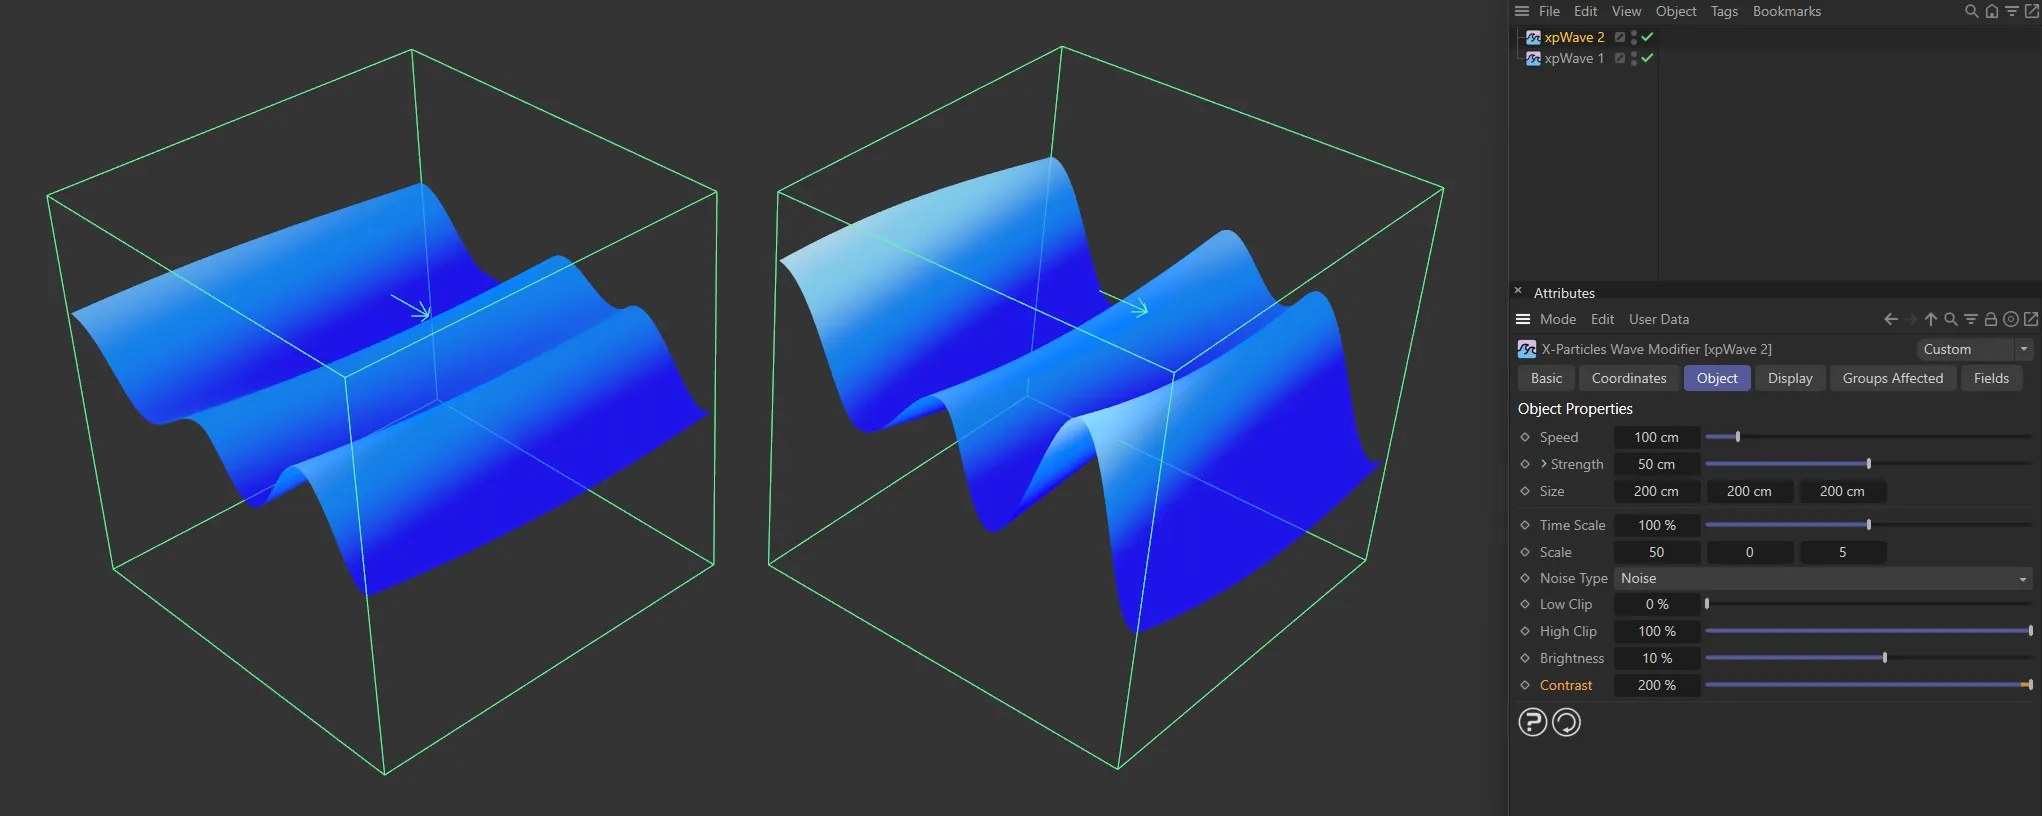
Here the Contrast is 100% on the left and 200% on the right.
Display tab
Section titled “Display tab”Draw Type
Section titled “Draw Type”Set as Surface, by default, this only affects the wave deformation display in the viewport.
The alternatives are: None, Line, Arrow, Grid and Plane.
It has no effect on the final result.
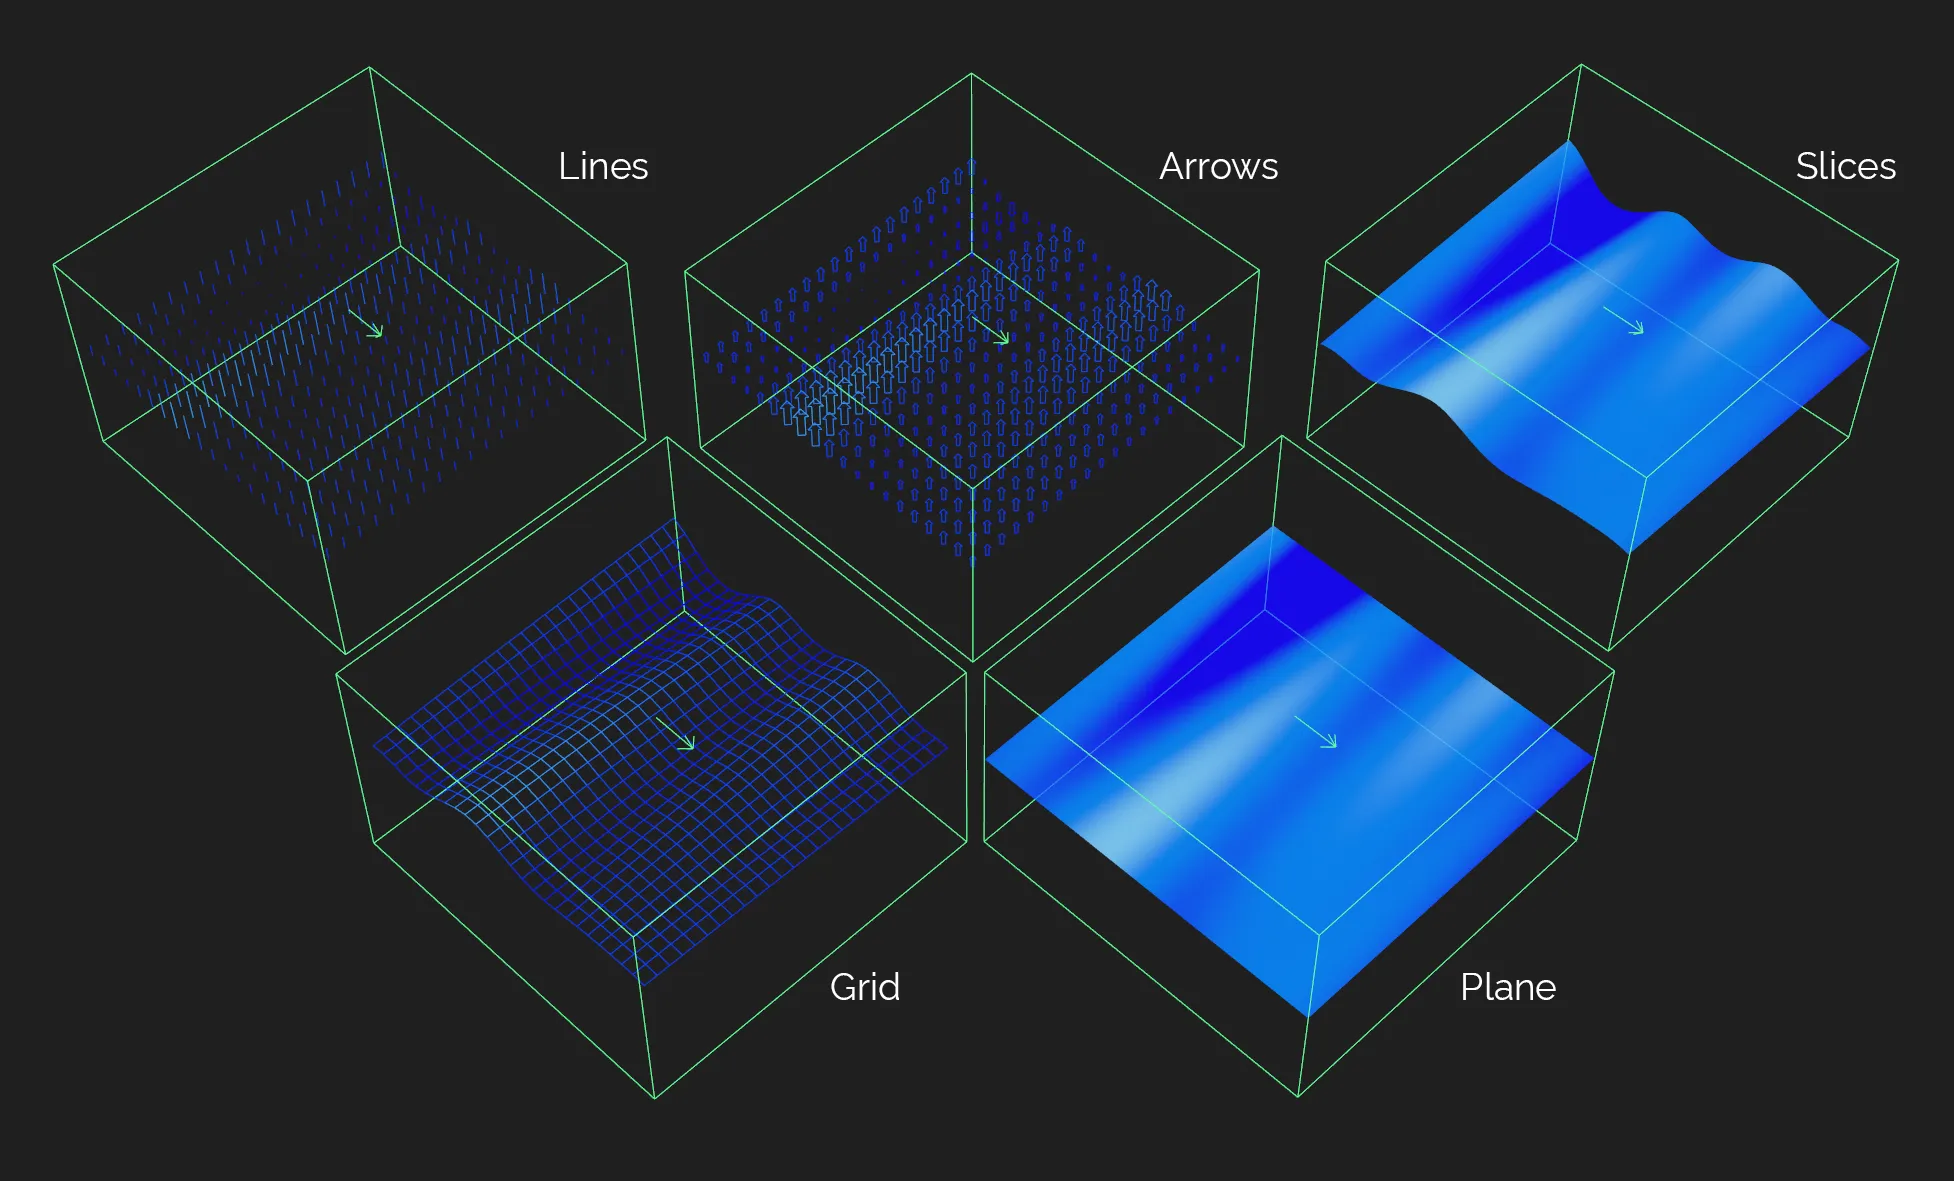
The five Draw Type settings (None is not shown).
The wave deformation is not shown.
The deformation is shown as a series of lines; the length of the line representing the amount of deformation at that point.
The same as the Line display, but the arrow also shows the direction of deformation.
Surface
Section titled “Surface”The deformation is shown as a solid object deformed by the wave.
Instead of a solid plane, a grid is shown.
The deformation is represented by color change on the surface of a flat (non-deformed) plane.
This gradient gives the colors used to represent the height of the deformation.
The greater the height, the more the color used moves towards the right-hand end of the gradient.
Slices
Section titled “Slices”You can increase this value to see multiple examples of the deforming surface.
It has no effect on the final result.
Grid Spacing X, Grid Spacing Y
Section titled “Grid Spacing X, Grid Spacing Y”This is also for visual display only; it determines the grid size used in the display.
The higher the value, the coarser the grid, but the effect on the fluid is unchanged.
Groups Affected tab
Section titled “Groups Affected tab”Groups
Section titled “Groups”To specify the group, drag and drop the desired Group object into this field.
This setting is useful if you want to ensure that the spawned particles are, or are not, affected by xpWave.
Fields tab
Section titled “Fields tab”You can use the Fields options to control where xpWave operates.
Copyright © 2026 INSYDIUM LTD. All rights reserved.