

Particle Console
The Particle Console is a live inspector for the running simulation. It reads the particle data straight from the GPU and shows you the counts, distributions and per-particle values as the sim plays.
It is a separate tool window, not a panel in the Physics tab. Use it to check what your particles are actually doing: how many there are, how fast they are moving, how their speed or age is spread across the population, which particles have collided or died and the exact values on any single particle.
Opening the console
Section titled “Opening the console”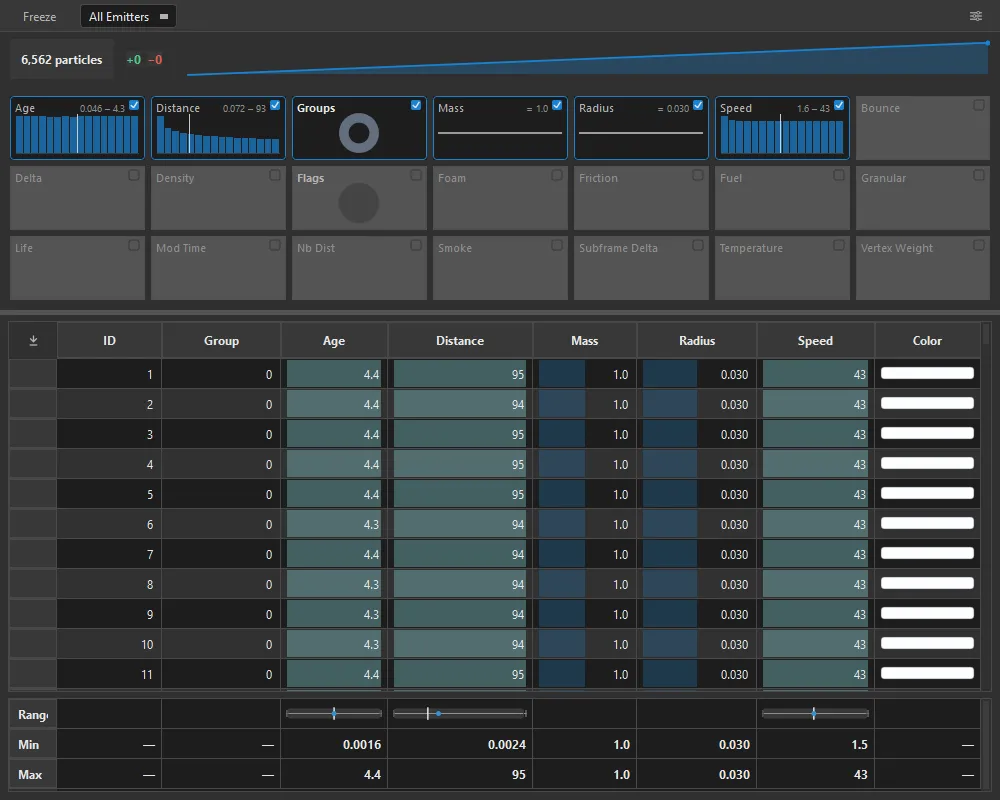
The NeXus Particle Console: the toolbar and lifecycle strip along the top, the per-attribute distribution wall, the per-particle table and the Min and Max stats footer. The readouts fill in as a simulation runs. New in 2026.0.1: Emitter filter
The console opens from the NeXus Hierarchy.
- In the 3D viewport, open the N-panel and choose the NeXus tab.
- On the Hierarchy page, click Open Particle Console.
The console opens as its own window, titled NeXus Particle Console, that floats above Blender so you can keep it in view while the viewport plays. Only one console window exists at a time. Clicking the button again brings the existing window to the front rather than opening a second one.
Play the timeline to run the simulation. The console refreshes on every frame that the sim advances, so the readouts update live as particles are born, move and die. Close the window when you are done. Its layout and settings are remembered for next time.
Reading the console
Section titled “Reading the console”The console is arranged top to bottom: a toolbar, a lifecycle strip, a distribution wall, the particle table and a stats footer. Each part can be turned on or off from the settings menu, so your own layout may show fewer of them.
Toolbar
Section titled “Toolbar”The toolbar holds the Freeze button, the emitter filter and the settings gear.
Freeze pauses the readouts while the simulation keeps running. It is useful for studying a moment without the numbers changing under you. You can also toggle it with Ctrl+F. The gear opens the settings menu, covered below.
The emitter filter is a dropdown that limits every readout to a single emitter. It defaults to All Emitters, which shows the whole population. Pick an emitter from the list and the count, the distribution wall, the table and the stats footer all narrow to just that emitter’s particles. New in 2026.0.1
Lifecycle strip
Section titled “Lifecycle strip”The lifecycle strip is the population summary at the top.
It shows the current particle count, a born and died delta for the latest step (the number gained in green and the number lost in red) and a count sparkline tracing how the total has risen and fallen over recent frames.
Distribution wall
Section titled “Distribution wall”The distribution wall is a grid of small tiles, one per particle value that varies across the population, such as Speed, Age, Mass and Radius. Each tile draws a mini histogram of how that value is spread across all the particles, along with its current range. A tile that shows a flat line means the value is the same on every particle.
The tiles double as column switches. Click a tile to add that value as a column in the particle table below, and click it again to remove it. A tile can also flag a distribution worth a second look, for example when a large share of particles sit at the minimum or pile up in the upper tail.
There are also two donut tiles. The Groups tile shows how the particles are shared across the nxGroups in the scene, and clicking it adds or removes the Group column. The Flags tile shows how the status flags are shared across the population, and clicking it adds or removes the Flags column.
Right-click any tile to copy its statistics (minimum, median, maximum, average and standard deviation) to the clipboard.
Particle table
Section titled “Particle table”The particle table is the per-particle inspector. Each row is one particle and each column is one of its values.
By default the columns are ID, Group, Age, Distance, Mass, Radius, Speed and Color. Add or remove columns from the distribution wall or the settings menu. Speed is the length of the particle’s velocity, and Age is how long the particle has existed.
Click a column header to sort by that value. Click a row to select a particle: the console then tracks that same particle by its ID from frame to frame, so you can watch one particle’s values change as the sim runs, even as the rows around it shift.
Group shows which nxGroup a particle belongs to. The column is shown by default, and its values fill in once the scene has groups. Color shows the particle’s color as a swatch, a value or both. One more column, Flags, is off by default: turn it on to decode each particle’s status bits into readable names, such as Collided, Born, Die, Stuck, Escaped and Group Changed.
To copy values out, right-click a cell to copy that single value or the whole row, or select a row and press Ctrl+C. For a Color cell you can copy the color as hex, as floats or as bytes.
The auto-scroll button in the top-left corner of the table sticks the view to the newest particles as they are added. When there are no particles the table reads No particles to display.
Stats footer
Section titled “Stats footer”The stats footer sits under the table and summarizes each visible column across the whole population. Each column shows a Range strip with its Min and Max below it. Hover a footer cell for the fuller statistics, or right-click it to copy them: Min, Max, Average, Median and Spread (the standard deviation).
Settings
Section titled “Settings”The gear button in the toolbar opens the settings menu. Changes take effect at once and are remembered between sessions.
Presets
Section titled “Presets”Three presets set the whole layout in one click. Minimal strips the console back to the count and table. Default is the standard layout. Analyst turns everything on, including the Group and Flags columns, and raises the precision.
Show Data
Section titled “Show Data”Choose which columns appear in the table: any of the distribution fields, plus Group, Color and Flags. This is the same set the distribution tiles toggle.
Readouts
Section titled “Readouts”Turn the major sections on or off: the Lifecycle strip (and, within it, the Particle count, the Born / died delta and the Count sparkline), the Distribution wall (with an Active tiles only sub-toggle), the Stats footer and the Auto-scroll button. The same section also controls how values are drawn. Magnitude bars draw a small bar behind each cell to show its value relative to the column’s range, making outliers easy to spot. Significant figures sets how many digits the numbers show, from 2 to 4. Row density switches the table between Comfortable and Compact rows.
Motion
Section titled “Motion”Freeze readouts is the same pause as the toolbar button (Ctrl+F). Refresh sets how often the display redraws: Every frame, Every 3rd or Every 10th. Throttling the refresh keeps the console light on very large or fast simulations. Note that freezing or throttling only affects the display. The simulation itself is unaffected.
Copyright © 2026 INSYDIUM LTD. All Rights Reserved.